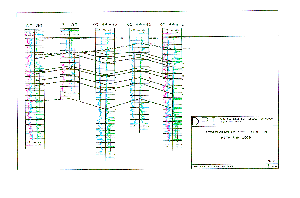
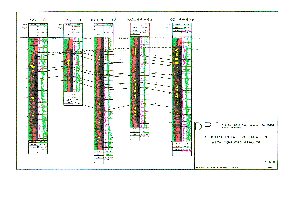
After the preliminary petrophysical work was completed, the results were used to refine the formation tops and to identify stratigraphic changes in the mapped units. The lithology and porosity evaluations were particularly useful in correlating intervals of clean and shaly diatomite within the Monterey. Examples of cross-sections using raw log data and computed log data are shown in Figures 2 and 3.
| Fig. 2: Stratigraphic Cross Section using Raw Logs |
Fig. 3: Stratigraphic Cross Section using Computed Results |
 |
 |
Tops were stored in GeoGraphix, in Petrolog, and in Symbiolog to be used for further processing and easy retrieval.
Rock and Reservoir Properties. Rock properties were primarily derived from the log data using laboratory measurements to calibrate and refine the parameter selection. Approximately one-fifth of the wells in the project area had porosity logs; the rest were old wells with ES and IES logs only. All analysis and zone summations were done using the Symbiolog system, running as an add-on to the Petrolog program. (A more detailed discussion of Symbiolog occurs in the Log Analysis of the workshop notes).
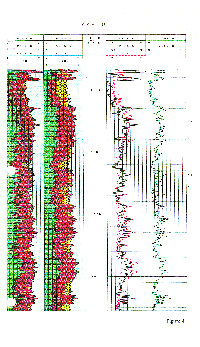
The McKittrick core wells were analyzed first, and a preliminary set of parameters was developed. These were then applied to the Pioneer area wells with porosity logs. Necessary refinements were made until a good fit was obtained to field data. Then, these same wells were re-analyzed with a subset of their curves similar to that available in the E-log only wells. First, a clay volume curve was computed from the SP log, with the resistivity curve used to supplement it where needed. Then, after extensive data analysis, a depth-based porosity transform was developed to compute a total-porosity curve. From this and the clay-volume curve, effective porosity was calculated using the same parameters as had been used for the porosity-log wells. A comparison of the results from the full-suite and e-log only analysis methods is shown in Figure 4.
Water saturation was not calculated for wells without an induction log, since the old
lateral logs do not give a valid true resistivity on a foot-by-foot basis.
Zone summations were performed on all wells using the correlated tops developed from cross sections. Since water saturation data were not available from many wells, only clay volume and porosity were summed to give values for reservoir rock and pay values were not computed.
Mapping. Many maps were drawn during the course of this project, and many more can be made using the log curve data and the summation results. The regional surface geologic map was digitized and entered into the project database. Cultural features (e.g., roads and other surface facilities) were extracted from commercially available databases and loaded to GeoGraphix for use as overlays on the maps.
With the sparse well spacing and complex structure present at Pioneer Anticline, computer gridding and contouring is not adequate for accurate representation of the geology. To ensure that the maps and cross sections tie properly in this type of setting, structure maps were drawn by hand, digitized, and gridded from the contours. The grids were then used for mathematical manipulations. Drafted maps can be created from combinations of the cultural overlays and contoured grids. Several isopach and properties maps, such as clay volume and porosity, were also made.
The computed curves for all 45+ project wells were delivered to MTU where they will eventually be used to construct more maps and cross sections of internal heterogeneities within the Monterey reservoir using the GeoGraphix Exploration System.
Data Distribution. In a field study project at an oil company, many people commonly have input and an interest in the results. The increasing integration of various engineering disciplines, geology, operations, and finance/accounting into project teams demands that information be exchanged efficiently among individuals with diverse requirements. Each team member needs somewhat different output from the field study, and needs it presented in different formats. A primary deliverable of this project is a database structure in the Toolbook Multimedia Database Management System, populated with data and results from the study, that can serve as a model for storage and dissemination of information for other field studies.
This database has the capability of storing graphic images, as well as text and digital data. This is very important, because visualization of the results of field study projects is becoming a critical need. Often, the visualizations are the best vehicle for conveying understanding of a complex reservoir to team members who may not be used to "seeing" three-dimensional reality from two-dimensional cross sections and maps.
Visualization images are being generated for this project in GeoGraphix and in MatLab,
using the results from the reservoir characterization.
Figure Captions
Figure 2 : A stratigraphic cross section is shown through several wells on Pioneer Anticline that include the entire Etchegoin and Monterey section. Wells 65-30, 76-30, and KCL 44-375 all had full suites of modern logs. Wells KCL 44-32 and KCL 44-43 had old electric logs. Lithologic changes in the Monterey are difficult to see.
Figure 3 : The same cross section shown in Figure DPI-1, except using the computed log results with the lithology track shown in colorfill. The Monterey lithologic changes are much clearer using the computed results logs.
Figure 4 : The results of the full-suite and e-log only analysis are compared for well 72-30. Track 1 shows the lithology analysis from the full log suite, Track 2 shows the same analysis using e-log only. Track 3 compared the effective porosity computed from the full suite (PHIEDW) and from the e-log only model (PHESDW). In Track 4, the clay volume curves from the two models are compared (VCLWDW from the full suite, VCWSDW from the e-log only model).
Fig. 4: Results of Full-Suite and
E-Log Only Analysis
